SF Bay Area Bike Data
In this notebook we will be working on the Kaggle project: SF Bay Area Bike Share

Project In a nutshell
-
We are trying to predict the net change in the bike stock (bikes returned - bikes taken) at a specific station at a specific hour.
-
We have 3 datasets:
station data,trip data,weather data
Ensemble Models - Kaggle Submission
- In this notebook we will continue our analysis with bike data by applying tree based models
- We will implement Random Forest, Adaboost, Gradient Boosting and Stochastic Gradient Boosting algorithms
- We will submit our predictions to Kaggle at the end.
- Since trees and ensembles have many hyperparameters, in this notebook we try to explain some good practices regarding the usage of these hyperparameters
- Also we will implement Grid Search in order to tune these hyperparameters

Tree-based Models
- In part1 and part2 of our analyse on
bikesharedataset, we did explanatory analysis (EDA) and used Linear Regression for our prediction and Kaggle submission - We will try to improve our prediction score on the same dataset by more complex tree-based models
- Before diving directly into the project maybe it would be better to remind the tree based models
- So in this post we will review the trees and we will apply these models to our dataset in the next post

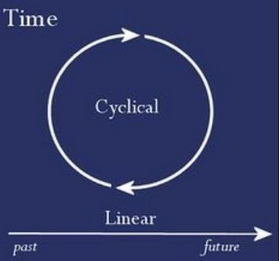
Cyclic Nature of Time- Kaggle Submission
- With this notebook we continue our analysis of
bikesharedataset. - In this part we will do machine learning steps in order to predict the bike rentals for the given Kaggle test set and submit it to the Kaggle
Feature Selection by Visualization
Thanks to Scikit-learn's instantiate-fit-tranform-predict template, we can run our formatted data through as many model as we like without having to continue to transform the data to fit each kind of model.
In Scikit-learn our main concern is optimazing the models.
For supervised problems,
- we know the target so we can score the model,
- we can easily throw the data at all different classifiers and
- score them to find the optimal classifier.
We can automate these steps but the difficulties for automation are:

Handling Missing Values
- In this notebook we summarize the methods to deal with missing values
- Missing values can happen because of human error, machine sensor malfunction, database failures, etc
- Missing values can reduce the predictive power and lead to biased results if not handled properly.
- There are different solutions for data imputation depending on the kind of the problem like time series analysis, regression etc.

ROC Curve & AUC
- We will talk about the classification models performance evaluation methods:
- Receiver Operating Characteristic(ROC) Curve and
- Area Under the ROC Curve (AUC)
- Classifiers generally don't return a simple “Yes-or-No” answer.
- Mostly, a classification procedure will return a score along a range
- Ideally, the positive instances score towards one end of the scale, and the negative examples towards the other end.
-
It is up to the analyst to set a threshold on that score that separates what is considered a POSITIVE class or a NEGATIVE class.
-
The ROC Curve is a tool that helps to set the best threshold.

Metrics - Precision, Recall, F1 Score
-
We continue with the methods of measurement of classification models' performance
-
The confusion matrix is very helpful to understand the details of our classifiers performance however we still need some metrics to interpret more directly to choose the best model
-
So in this notebook we will talk about the metrics like sensitivity (recall), specifity, precision and F1 score
- These metrics can be computed from a confusion matrix and are more efficient to choose the best model.
- In the first part we remind the concepts and in the second part we will apply these concepts for evaluating some classifiers' performance
- Skitlearn provides all these scores by
ClassificationReport
GPS Data Analysis
In this project we will
- analyze a gps dataset
- try to infer some ideas mainly from the coordinates (latitude, longitude) of the data.
- do some explanatory data analysis by filtering and grouping the data
- look for some patterns in different time frames.
- start analizing subject of interest from the longer time frames and follow by the shorter time frames

Metrics - Confusion Matrix
- In a typical data science project we try several models like (logistic regression, SVM, tree-classifiers etc) on our data.
- Then we measure the predicting performance of these models to find the best performing one.
- Finally we decide to implement the best performing model.
-
In this notebook we talk about one of the classification model evaluation tools: Confusion matrix.
-
They can help us to see deeper how much reliable our models are.
-
We are going to look at the confusion matrices of a variety of Scikit-Learn models and compare them using visual diagnostic tools from Yellowbrick in order to select the best model for our data.